AI data analysis, also known as artificial intelligence data analysis or AI-driven data analysis, refers to the process of using artificial intelligence and machine learning techniques.
Data Preprocessing
AI data analysis can begin, and raw data must be collected, cleaned.
Predictive Analytics
Algorithms use historical data to forecast future trends, behaviors.
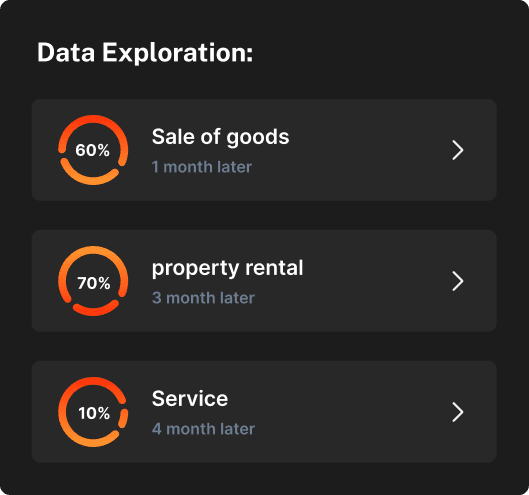
Widely used throughout the industry for work
1. Businesses and Corporations:
Businesses use AI data analysis to gain competitive advantages, optimize operations, & make data-driven decisions. This includes industries such as retail, finance, manufacturing.
2. Data Scientists and Analysts:
Data scientists and analysts leverage AI tools and algorithms to extract actionable insights from large datasets. They alsouse AI for predictive modeling, anomaly detection, and data visualization.
3. Government and Public Sector:
Government agencies use AI data analysis for various purposes, including public policy development, law enforcement, urban planning, and disaster.
Play Video
AI-powered that streamline tasks
As your business grows or your AI SaaS needs change, you can easily adjust your subscription level to match those needs. This flexibility ensures that AI remains an asset.
Customer service inquiries
0%
Using financial institutions
0%
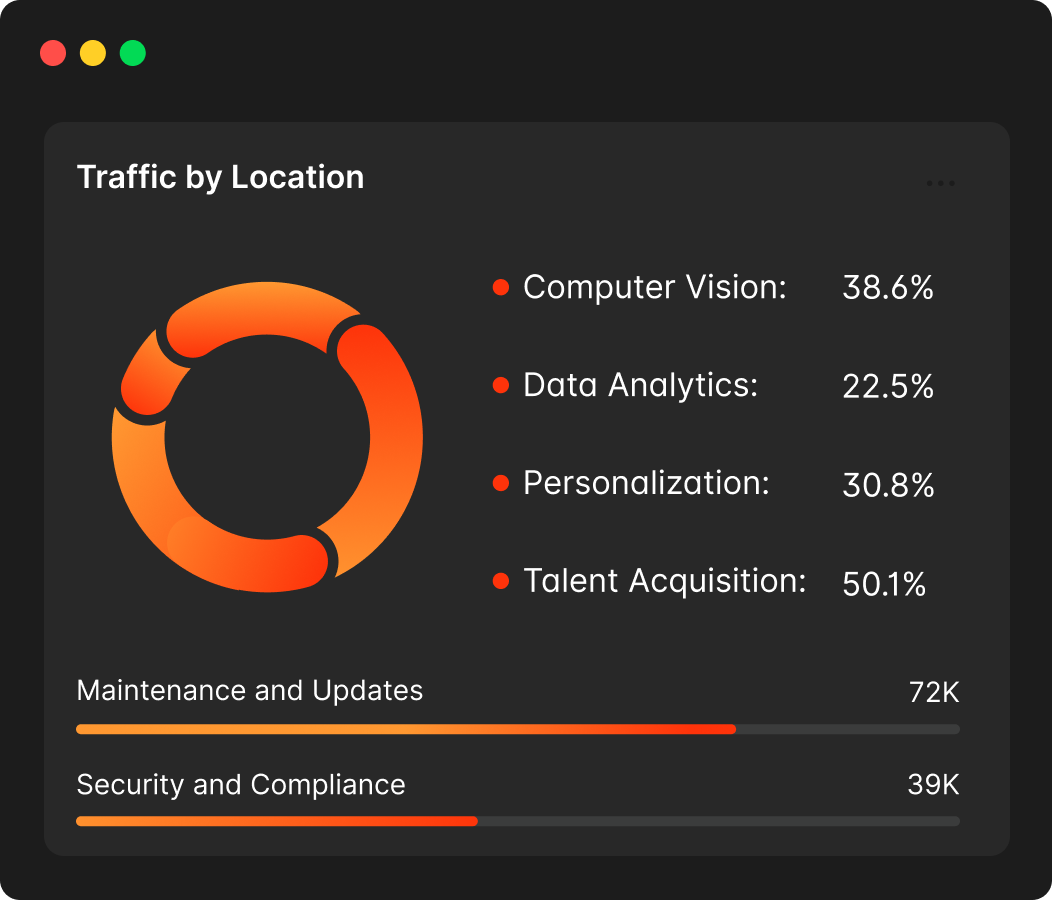
Manage large amounts of data
AI data analysis also can handle vast amounts of data, making it suitable for big data environments. Data analysis can automate many aspects of data processing and analysis
Real-Time Analysis
Some AI data analysis solutions are design to process making instant.
Automation
his leads to increased efficiency and quicker decision-making.
We always want to connect our clients
AI accessible and beneficial for organizations, and we look forward to partnering with businesses to achieve their AI goals.
Website: www.example.com
Email: info@example.com
Phone: (123) 456-7890
Plotting and auditing
One of the benefits of electronic growth charts is the reduction of incorrect plotting due to human error. Whatever measure is input you can be sure it will be plotted correctly. If measures are input incorrectly then these may be deleted and re-input. The audit trail however records every measure and every update and may not be altered or deleted.
Network access
The network system provides the full functionality needed to
plot and monitor child growth. Access for all Active Directory (AD) authorised users enables the growth chart to be reviewed instantly, potentially reducing incorrect referrals. Data may be imported or exported; if you have existing records in a suitable format they can be imported into iGROW eliminating the need to re-input existing data. The system also includes export functionality enabling further analysis in external packages such as Microsoft® Excel®.
Integration with EPR systems
iGROW uses API technology enabling the application to communicate with existing software. The concept is that the application will work as a ‘plug in’ to your existing child health system, passing previously recorded information to iGROW to facilitate plotting and growth chart display. This functionality eliminates the need to enter patient details twice, as the essential information to enable plotting of the growth charts is simply passed through the API and a plotted chart returned for review. We have integrated with most of the leading EPR systems in use in the UK for Hospitals and Community services.
Monitor patient data over 20 years
iGROW gives you the ability to plot height/weight and calculate the BMI for each newborn or child from the pre-term stage until they are 20 years old. Using the latest UK National Standard Growth Charts, including the UK Down Syndrome Charts, UK Turner Syndrome Charts, Blood Pressure Charts, and the new UK Sitting Height Charts, you are able to plot the data and view the correct chart along with any and all interventions made to the child’s health record.
All data input and/or altered is fully auditable utilising our back office functions. Through the use of assigned individual licences, information entered is then tracked back to the individual user.
iGROW is the only system in the UK which utilises the UK data behind the chart to calculate accurate measurements.